
For studios · Insights
Reports
Detailed breakdowns by revenue, bookings, classes, instructors, and more, for any date range, ready to export.
Where Analytics gives you the summary, Reports lets you dig into the detail and take the numbers with you. Open Insights → Reports.
Pick a period
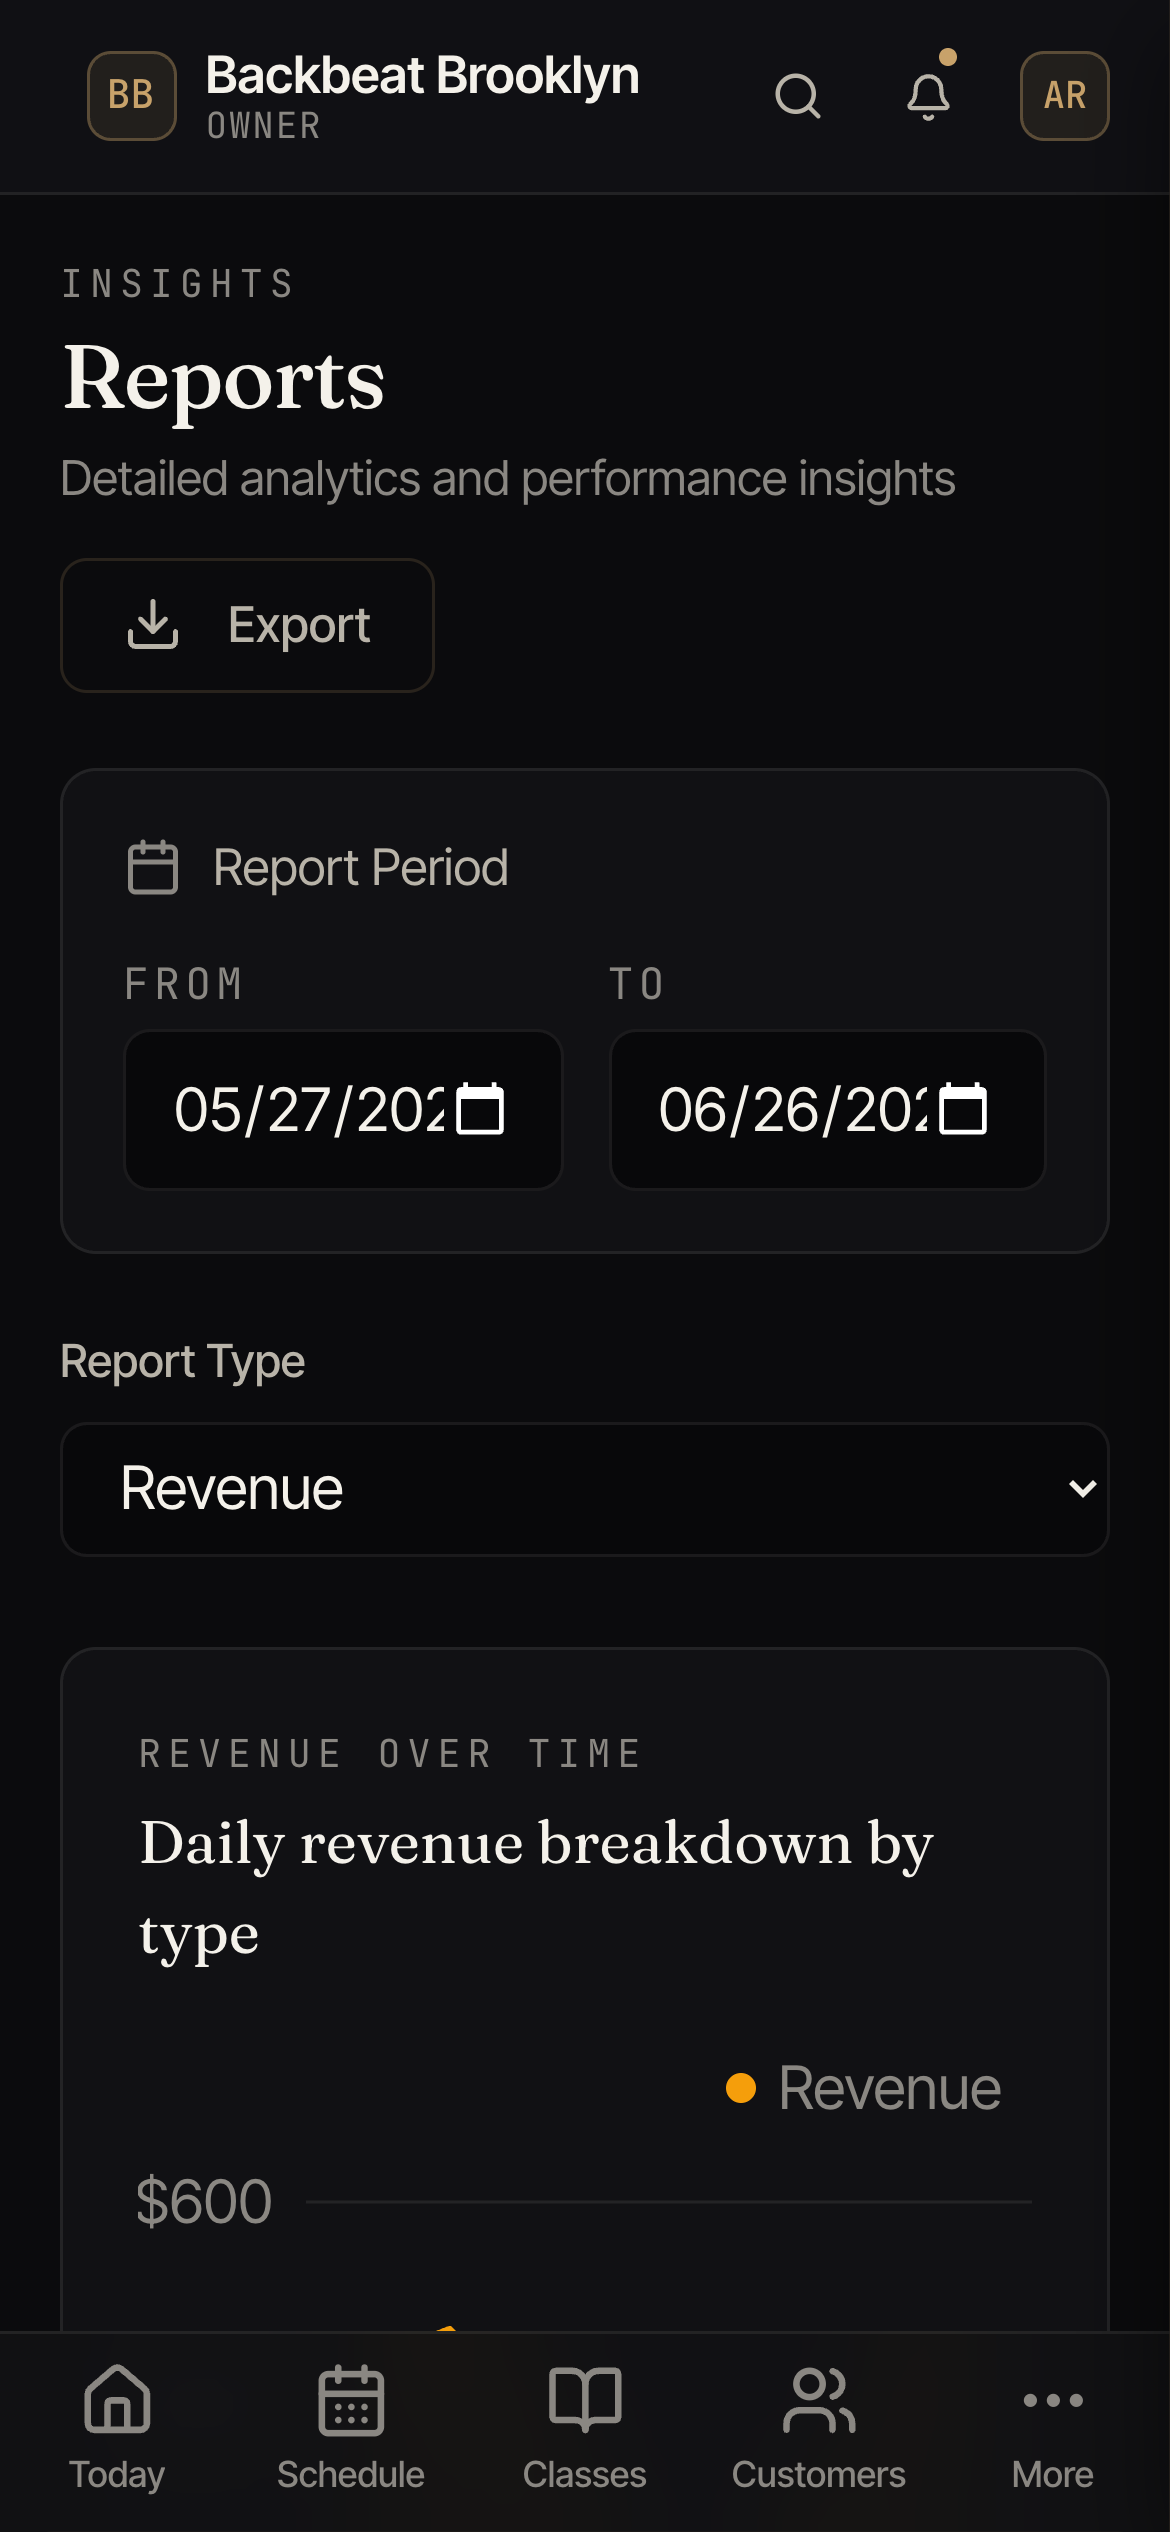
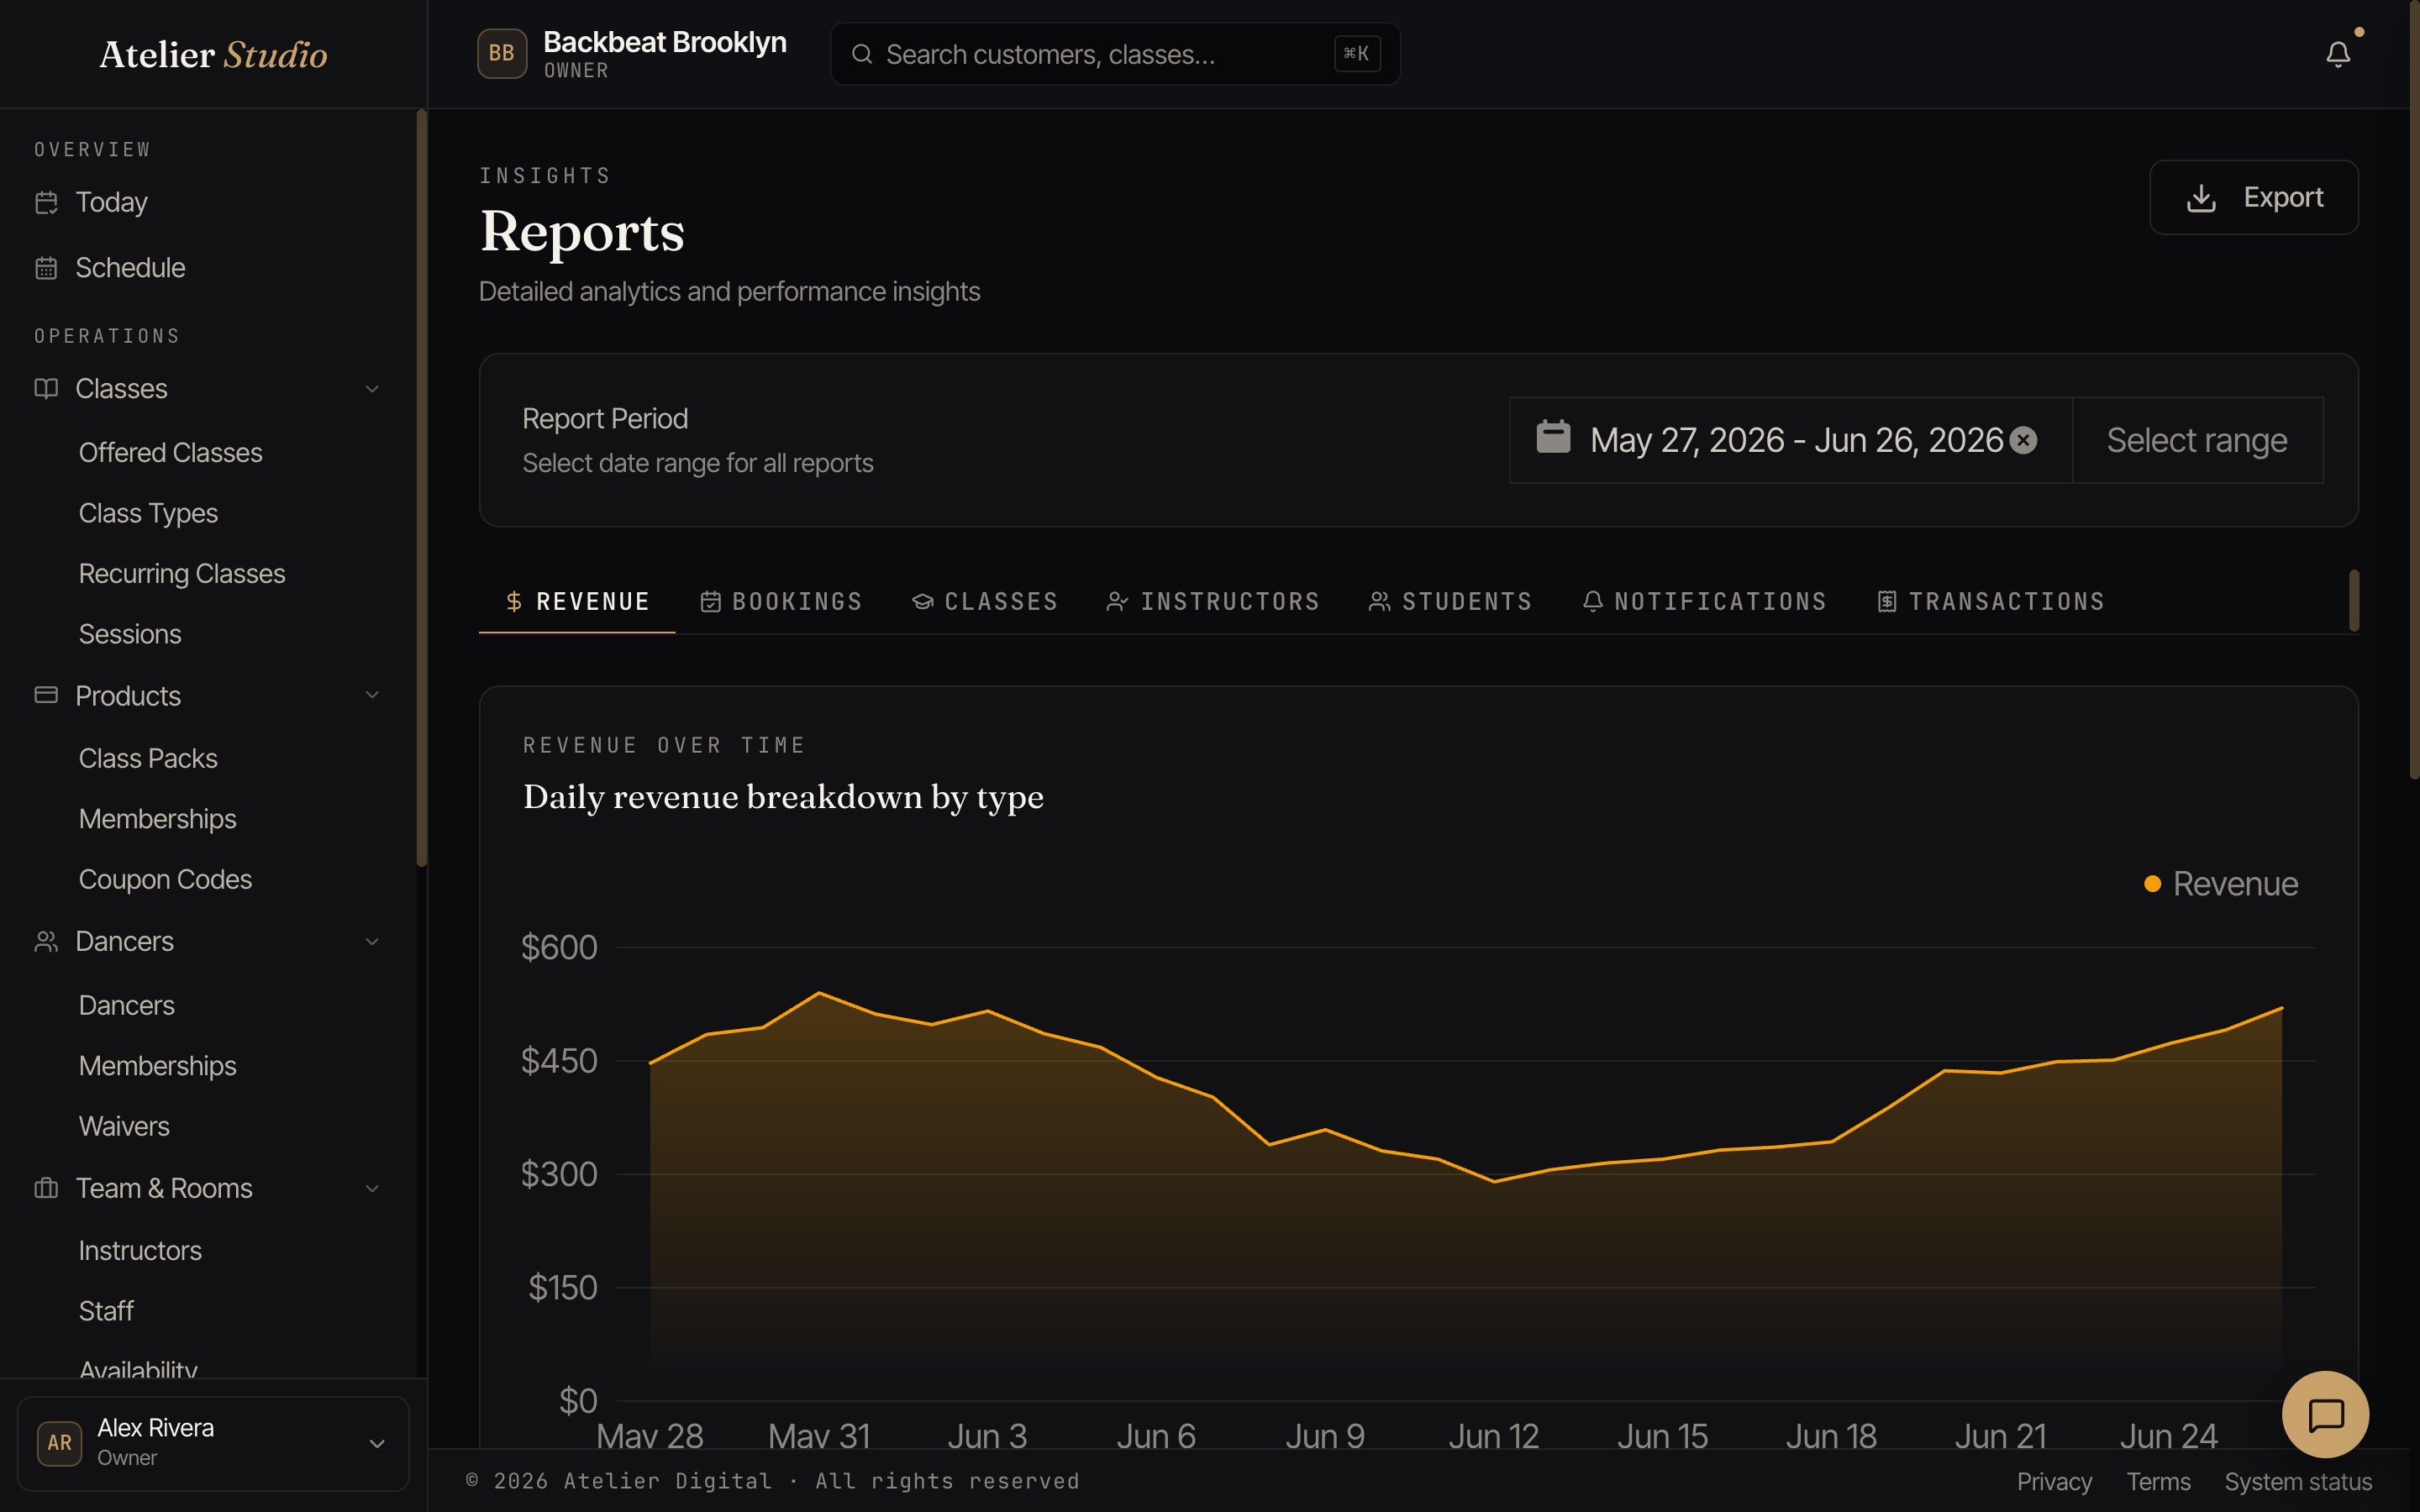
Set the report period with the date-range picker at the top, and every report below updates to match.
Choose what to look at
The tabs let you switch between Revenue, Bookings, Classes, Instructors, Students, Notifications, and Transactions, each with its own charts and tables.
The Students tab counts your active students the same way the Today screen does (people who’ve attended a class in the last 30 days), next to new and returning students for the period, so bringing your history over from another system won’t inflate the number.
Refunds and lost disputes in your totals
The Revenue tab and the Sales report both show Lost disputes as their own line, apart from refunds. On the Sales report, the totals at the bottom show Refunds, Lost disputes, and then your revenue after both. These lines only appear when the amount is more than zero.
A lost dispute is counted in the period of the original payment. The Stripe dispute fees line is shown on its own. Stripe takes this fee when a customer disputes a payment. It is not taken out of the revenue above. The Sales export file does not include these new lines yet.
Attendance vs. how full your classes are
The Classes tab shows two “how’s it going” numbers that look similar but answer different questions. It’s worth knowing which is which:
- Capacity utilization (your average fill rate): how full your classes ran, measured against the seats available.
- Attendance rate: of the people who booked and didn’t cancel ahead of time, how many actually showed up. No-shows count against it; people who cancelled in advance don’t.
A class can be full but have a couple of no-shows, or quiet but have everyone turn up. These two numbers let you tell those apart. You’ll also find an Attendance column for each instructor on both the Classes and Instructors tabs, so you can see who’s keeping their rooms full and their students showing up.
Payouts report
The Payouts report lists the money Stripe sent to your bank, by the day it arrives, with what is inside each payout. See The Payouts report.
Export
Select Export to download the current report. It’s perfect for your bookkeeper, a tax return, or a closer look in a spreadsheet.